Some people believe that children leisure activities must be educational, otherwise they are a complete waste of time. Do you agree or disagree? Model Answer: Today, education has become a priority for many parents seeking to secure a good... 详情>>
2019-02-18
It is often said that the subjects taught in schools are too academic in orientation and that it would be more useful for children to learn about practical matters such as home management, work and interpersonal skills. To what extent do yo... 详情>>
2019-02-18
Learning a foreign language offers an insight into how people from other cultures think and see the world. The teaching of a foreign language should be compulsory at all primary schools. To what extent do you agree or disagree with this vie... 详情>>
2019-02-18
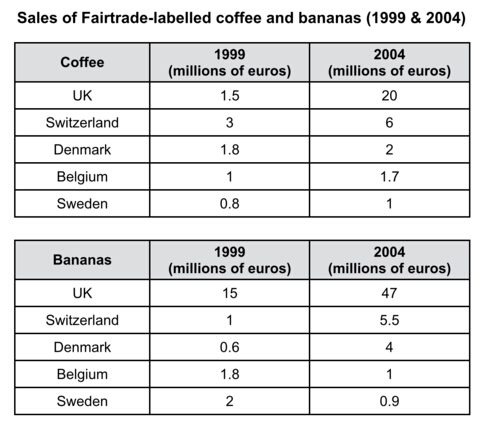
话题:The tables below give information about sales of Fairtrade*-labelled coffee and bananas in 1999 and 2004 in five European countries. 范文 *Fairtrade: a category of products for which farmers from developing countries have been pa... 详情>>
2019-02-15
话题: The map shows the village of Chorleywood showing development between 1868 and 1994 范文 The map shows the growth of a village called Chorleywood between 1868 and 1994. It is clear that the village grew as the transport infrastru... 详情>>
2019-02-15
很多考鸭在攻克了词汇、语法及审题的难关后,雅思写作的成绩还是卡在5-5.5的分数段,其实,大部分的原因是“Coherence and Cohesion”这个标准掌握欠佳。 我们花费了大量时间,去记忆... 详情>>
2019-02-13
话题 The graph below shows changes in global food and oil prices between 2000 and 2011. 范文 The line graph compares the average price of a barrel of oil with the food price index over a period of 11 years. It is clear that average glob... 详情>>
2019-02-13
话题 The graph below shows the amounts of waste produced by three companies over a period of 15 years. 范文 The line graph compares three companies in terms of their waste output between the years 2000 and 2015. It is clear that there w... 详情>>
2019-02-13
话题 The graph below shows the proportion of the population aged 65 and over between 1940 and 2040 in three different countries. 范文 The line graph compares the percentage of people in three countries who used the Internet between 1999... 详情>>
2019-02-12
话题 The climograph below shows average monthly temperatures and rainfall in the city of Kolkata. 范文 The line graph compares three companies in terms of their waste output between the years 2000 and 2015. The chart compares average fi... 详情>>
2019-02-12


