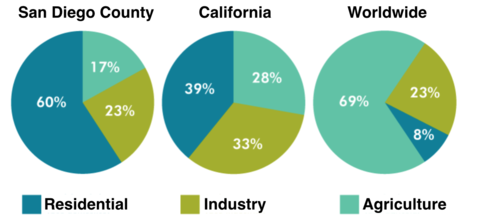
The pie charts below compare water usage in San Diego, California and the rest of the world.
该饼图展示美国圣地亚哥县,加利福利亚州和世界其余地方的用水比较。请作答。
雅思图表小作文饼图题型9分范文:
The pie charts give information about the water used for residential, industrial and agricultural purposes in San Diego County, California, and the world as a whole.
It is noticeable that more water is consumed by homes than by industry or agriculture in the two American regions. By contrast, agriculture accounts for the vast majority of water used worldwide.
In San Diego County and California State, residential water consumption accounts for 60% and 39% of total water usage. By contrast, a mere 8% of the water used globally goes to homes. The opposite trend can be seen when we look at water consumption for agriculture. This accounts for a massive 69% of global water use, but only 17% and 28% of water usage in San Diego and California respectively.
Such dramatic differences are not seen when we compare the figures for industrial water use. The same proportion of water (23%) is used by industry in San Diego and worldwide, while the figure for California is 10% higher, at 33%.
责任编辑:admin

① 凡本网注明“稿件来源:北京新东方学校”的所有文字、图片和音视频稿件,版权均属北京市海淀区私立新东方学校所有,转载请注明“来源:北京新东方学校”。
② 本网未注明“稿件来源:北京新东方学校”的文/图等稿件均为转载稿,本网转载仅基于传递更多信息之目的,并不意味着赞同转载稿的观点或证实其内容的真实性。如其他媒体、网站或个人从本网下载使用,需自负版权等法律责任。如擅自篡改为“稿件来源:北京新东方学校”,本网将依法追究法律责任。
③ 如有本网转载稿涉及版权等问题,请作者见稿后速来电与北京新东方网联系,电话:010-62578989。
