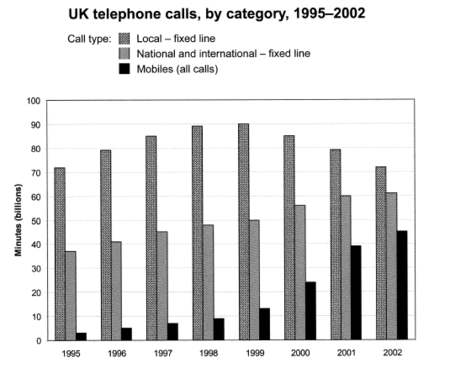
The chart below shows the total number of minutes (in billions) of telephone calls in the UK, divided into three categories, from 1995-2002.
该柱状图展示英国1995-2002年间不同类型的电话通话时长,包括本地固话,长途固话,和手机通话。请作答。
雅思图表小作文柱状图题型提纲:
Introduction: rewrite the question statement in your own words.
Overview: point out which category was highest in each year, which was lowest, and which saw the biggest changes.
Details: compare the 3 categories in 1995, then say what happened up until 1999.
Details: notice what happened to local calls from 1999 onwards, and contrast this with the other 2 categories. Finish with a comparison of the figures in 2002.
雅思图表小作文柱状图题型9分范文:
The bar chart compares the amount of time spent by people in the UK on three different types of phone call between 1995 and 2002.
It is clear that calls made via local, fixed lines were the most popular type, in terms of overall usage, throughout the period shown. The lowest figures on the chart are for mobile calls, but this category also saw the most dramatic increase in user minutes.
In 1995, people in the UK used fixed lines for a total of just over 70 billion minutes for local calls, and about half of that amount of time for national or international calls. By contrast, mobile phones were only used for around 4 billion minutes. Over the following four years, the figures for all three types of phone call increased steadily.
By 1999, the amount of time spent on local calls using landlines had reached a peak at 90 billion minutes. Subsequently, the figure for this category fell, but the rise in the other two types of phone call continued. In 2002, the number of minutes of national / international landline calls passed 60 billion, while the figure for mobiles rose to around 45 billion minutes.
责任编辑:admin

① 凡本网注明“稿件来源:北京新东方学校”的所有文字、图片和音视频稿件,版权均属北京市海淀区私立新东方学校所有,转载请注明“来源:北京新东方学校”。
② 本网未注明“稿件来源:北京新东方学校”的文/图等稿件均为转载稿,本网转载仅基于传递更多信息之目的,并不意味着赞同转载稿的观点或证实其内容的真实性。如其他媒体、网站或个人从本网下载使用,需自负版权等法律责任。如擅自篡改为“稿件来源:北京新东方学校”,本网将依法追究法律责任。
③ 如有本网转载稿涉及版权等问题,请作者见稿后速来电与北京新东方网联系,电话:010-62578989。
