【小作文】
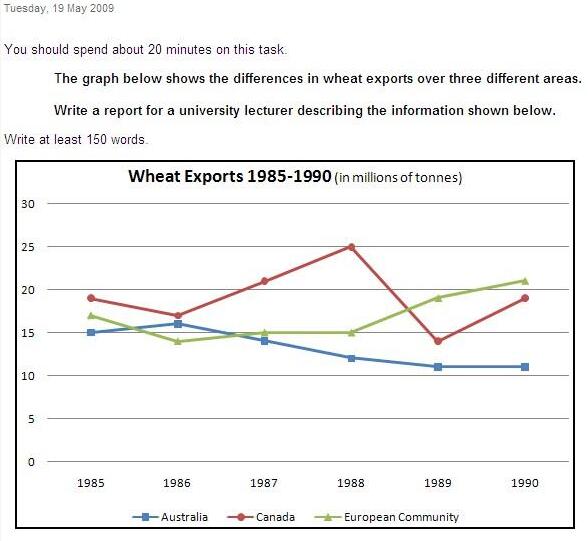
线 图
题目:The graph below shows the differences in wheat exports over three different areas. Write a report for a university lecturer describing the information shown below.

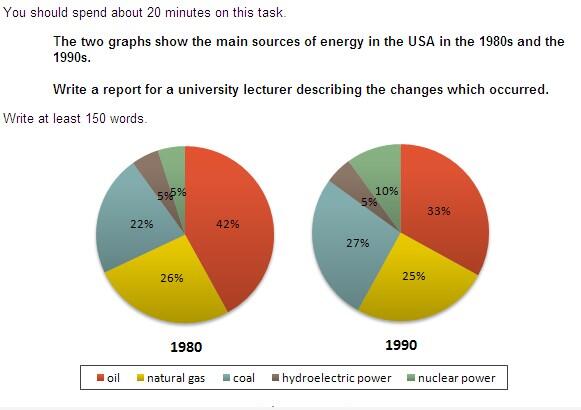
饼 图
题目:The two graphs show the main sources of energy in the USA in the 1980s and the 1990s. Write a report for a university lecturer describing the changes which occurred.

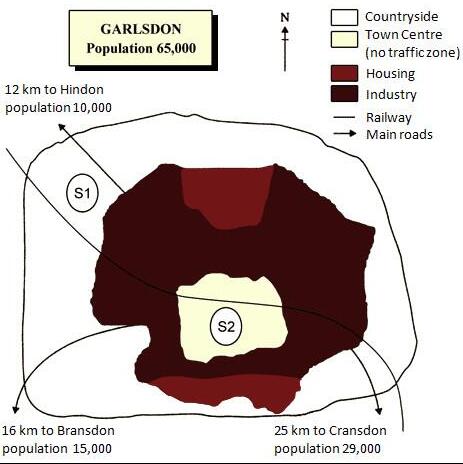
地 图
The map below is of the town of Garlsdon. A new supermarket (S) is planned for the town. The map shows two possible sites for the supermarket. Summarise the information by selecting and reporting the main features, and make comparisons where relevant. You should write at least 150 words. Allow yourself 20 minutes for this task.

责任编辑:admin

① 凡本网注明“稿件来源:北京新东方学校”的所有文字、图片和音视频稿件,版权均属北京市海淀区私立新东方学校所有,转载请注明“来源:北京新东方学校”。
② 本网未注明“稿件来源:北京新东方学校”的文/图等稿件均为转载稿,本网转载仅基于传递更多信息之目的,并不意味着赞同转载稿的观点或证实其内容的真实性。如其他媒体、网站或个人从本网下载使用,需自负版权等法律责任。如擅自篡改为“稿件来源:北京新东方学校”,本网将依法追究法律责任。
③ 如有本网转载稿涉及版权等问题,请作者见稿后速来电与北京新东方网联系,电话:010-62578989。
